Sexy Charts in Less Than 5 Minutes
date = “NOV” slug = “NOV/sexy-charts-in-less-than-5-minutes”
Last time, in our ‘do it in less than 5 minutes’ series, we saw how to add quickly and simply add Ajax pagination.
This time we’ll see how to add some sexy/fancy charts to your rails app.
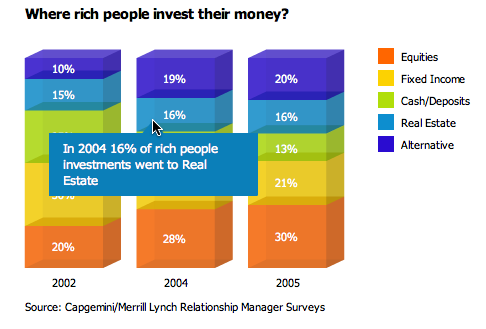
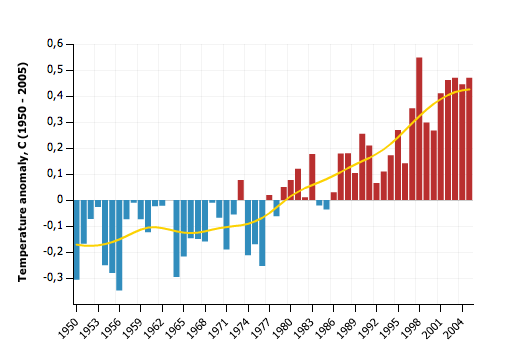
The goal is to end up with something like:


Various options
You might have heard or even tried solution such as Gruff or JFreeChart.
While these solutions are great, they are certainly a pain in the butt. Gruff requires RMagick (avoid RMagick as much as can) and creates static files (a real pain when your graphs change all the time) JFreeChart on the other hand requires Java, Java skills and I hate the way you create graphs:
1<tt>
</tt>2<tt>
</tt>3<tt>
</tt>4<tt>
</tt><strong>5</strong><tt>
</tt>


  <span class="r">def</span> <span class="fu">CreateChart</span><tt>
</tt>         pipe = <span class="co">IO</span>.popen <span class="s"><span class="dl">"</span><span class="k">java -cp C:</span><span class="ch">\\</span><span class="k">InstantRails</span><span class="ch">\\</span><span class="k">rails_apps</span><span class="ch">\\</span><span class="k">project</span><span class="ch">\\</span><span class="k">jfree</span><span class="ch">\\</span><span class="k">src;C:</span><span class="ch">\\</span><span class="k">InstantRails</span><span class="ch">\\</span><span class="k">rails_apps</span><span class="ch">\\</span><span class="k">project</span><span class="ch">\\</span><span class="k">jfree</span><span class="ch">\\</span><span class="k">lib</span><span class="ch">\\</span><span class="k">jcommon-1.0.0-rc1.jar;C:</span><span class="ch">\\</span><span class="k">InstantRails</span><span class="ch">\\</span><span class="k">rails_apps</span><span class="ch">\\</span><span class="k">project</span><span class="ch">\\</span><span class="k">jfree</span><span class="ch">\\</span><span class="k">lib</span><span class="ch">\\</span><span class="k">jfreechart-1.0.0-rc1.jar; CreateChart</span><span class="dl">"</span></span> <tt>
</tt>         pipe.close<tt>
</tt>         redirect_to <span class="s"><span class="dl">"</span><span class="k">/graph/report</span><span class="dl">"</span></span> <tt>
</tt>      <span class="r">end</span>
Anyway, none of these solutions would let us create our charts in less than 5 minutes so let’s cut the story short. The best solution IMHO is to use Flash. But wait, you don’t need to know ActionScript or to own a license of Flash or Flex, we have libraries available for us to use without any Flash knowledge :)
XML/SWF is cool Flash library which should fulfill our needs, you can even find a rails plugin to make things easier.
amCharts
But, to be honest I’d like to have something a bit “cleaner/sexy/fancy” and easier to setup. So we’re going to use amCharts Don’t get me wrong, XML/SWF is a great library and you can make your graphs look nice (but you have to pay for support). Since we are running out of time let’s see how to implement a nice graph using my favorite library.

[DISCLAIMER: amCharts is NOT open source and NOT free. But, it’s cheap (85 euros per site) especially when you think of how much time you will save. AND there is a FREE version. The Free version is the same as the full version but with a link back to amcharts.com]
Setup
Let’s go ahead and download one of the package: https://www.amcharts.com/column/download/ for instance.
Unpack the files and put them in their own folder in your public folder. Make sure you have the .swf file (amcolumn.swf for instance), a XML settings file and the fonts folder. (You might want to also create an empty amcharts_key.txt in the same folder since the plugin tries to load the key and you don’t want to pollute your logs.)
Usage
Now you need to understand how amCharts works.
After being loaded, amCharts expects a datastream. The datastream is then parsed and displayed as a chart. You can modify the aspect of any chart by changing its settings. Settings are set at runtime and/or in a setting file.
Great! I won’t cover the settings file. It’s a well documented XML file you just copied in your public folder. (or check the documentation)
What we want to focus on, is the datastream. Basically we just need to create a XML file that can be parsed by amCharts.
Let’s imagine that we have a reports_controller.rb file We want to display the population of the cities in California.
let’s add a new action to render our XML file:
1<tt>
</tt>2<tt>
</tt>3<tt>
</tt>4<tt>
</tt><strong>5</strong><tt>
</tt>6<tt>
</tt>7<tt>
</tt>8<tt>
</tt>


  <span class="r">def</span> <span class="fu">population</span><tt>
</tt>    <span class="iv">@cities</span> = <span class="co">City</span>.find(<span class="sy">:all</span>)<tt>
</tt>    <span class="iv">@population_data_link</span> = formatted_population_reports_url(<span class="sy">:xml</span>)<tt>
</tt>    respond_to <span class="r">do</span> |format|<tt>
</tt>      format.html<tt>
</tt>      format.xml  { render <span class="sy">:action</span> => <span class="s"><span class="dl">"</span><span class="k">population.xml.builder</span><span class="dl">"</span></span>, <span class="sy">:layout</span> => <span class="pc">false</span> }<tt>
</tt>    <span class="r">end</span><tt>
</tt>  <span class="r">end</span>
(notice that I’m using rails 2.0 and that’s why my XML template is not RXML)
As you can see, we have 2 values: @cities and @population_data_link
@cities contains all the City records, including their population etc..
@population_data_link contains the url to retrieve the datastream.
If you wonder how I got this url? I’m simply using a named route defined in my routes.rb:
<tt>
</tt>


  map.resources <span class="sy">:reports</span>, <span class="sy">:collection</span> => {<span class="sy">:population</span> => <span class="sy">:get</span>}
(note that you don’t need to create a restful route for that, a simple named route would have worked too)
Flash detection
Since we are going to use Flash, we want to make sure that people have the Flash plugin installed on their browser. For that we will use swfobject. Simply make sure to add swfobject.js (available in any amChart package) to your public/javascript folder. Then make sure you linked the javascript in your header:
<tt>
</tt>


  <%= javascript_include_tag <span class="s"><span class="dl">'</span><span class="k">swfobject</span><span class="dl">'</span></span> <span class="s"><span class="dl">%></span></span>
We now need to create our 2 views: population.html.erb and population.xml.builder
population.html.erb
Basically, this view only loads amCharts and provides it with the details of the datastream:
1<tt>
</tt>2<tt>
</tt>3<tt>
</tt>4<tt>
</tt><strong>5</strong><tt>
</tt>6<tt>
</tt>7<tt>
</tt>8<tt>
</tt>9<tt>
</tt><strong>10</strong><tt>
</tt>11<tt>
</tt>12<tt>
</tt>13<tt>
</tt>14<tt>
</tt><strong>15</strong><tt>
</tt>16<tt>
</tt>


  <div id=<span class="s"><span class="dl">"</span><span class="k">population_chart</span><span class="dl">"</span></span> <span class="r">class</span>=<span class="s"><span class="dl">'</span><span class="k">chart</span><span class="dl">'</span></span>><tt>
</tt>    <strong><span class="co">Text</span> displayed <span class="r">when</span> the user doesn<span class="s"><span class="dl">'</span><span class="k">t have Flash. You might want to display a simple table with the population, search engines and visitor without flash would love that.</strong><tt>
</tt>    <p> To see this page properly, you need to upgrade your Flash Player, please visit the Adobe web site</p><tt>
</tt>  </div><tt>
</tt><tt>
</tt>  <script type="text/javascript"><tt>
</tt>    // <![CDATA[    <tt>
</tt>    var so = new SWFObject("/amcolumn/amcolumn.swf", "population_chart", "800", "380", "8", "#000000");<tt>
</tt>    so.addVariable("path", "/amcolumn/");<tt>
</tt>    so.addVariable("settings_file", escape("/amcolumn/column_settings.xml"));<tt>
</tt>    so.addVariable("data_file", escape("<%= @population_data_link %>"));<tt>
</tt>    so.addVariable("additional_chart_settings", "<settings><labels><label><x>250</x><y>25</y><text_size>18</text_size><text><![CDATA[<b>California Population as of <%= Time.now.to_s(:db) %></b>]]></text></label></labels></settings>");<tt>
</tt>    so.addVariable("preloader_color", "#000000");<tt>
</tt>    so.write("population_chart");<tt>
</tt>    // ]]><tt>
</tt>  </script></span></span>
As you can see, we have a div called population_chart. This div is replaced at load time by the Flash object if the visitor has Flash setup locally. Think about providing some data in case the user doesn’t have Flash.
The rest is simple Javascript. I unpacked the amchart column lib in mypublic/amcolumn folder and that’s why I setup the path as “amcolumn”
<tt>
</tt>


  so.addVariable(<span class="s"><span class="dl">"</span><span class="k">path</span><span class="dl">"</span></span>, <span class="s"><span class="dl">"</span><span class="k">/amcolumn/</span><span class="dl">"</span></span>);
My settings file is called column_settings.xml :
<tt>
</tt>


  so.addVariable(<span class="s"><span class="dl">"</span><span class="k">settings_file</span><span class="dl">"</span></span>, escape(<span class="s"><span class="dl">"</span><span class="k">/amcolumn/column_settings.xml</span><span class="dl">"</span></span>));
and the most important part:
<tt>
</tt>


  so.addVariable(<span class="s"><span class="dl">"</span><span class="k">data_file</span><span class="dl">"</span></span>, escape(<span class="s"><span class="dl">"</span><span class="k"><%= @population_data_link %></span><span class="dl">"</span></span>));
Finally, I added some dynamic settings just to show you how easy it is:
1<tt>
</tt>2<tt>
</tt>


  so.addVariable(<span class="s"><span class="dl">"</span><span class="k">additional_chart_settings</span><span class="dl">"</span></span>,<tt>
</tt>  <span class="s"><span class="dl">"</span><span class="k"><settings><labels><label><x>250</x><y>25</y><text_size>18</text_size><text><![CDATA[<b>California Population as of <%= Time.now.to_s(:db) %></b>]]></text></label></labels></settings></span><span class="dl">"</span></span>);
Ok, let’s now create our XML view:
population.xml.builder
1<tt>
</tt>2<tt>
</tt>3<tt>
</tt>4<tt>
</tt><strong>5</strong><tt>
</tt>6<tt>
</tt>7<tt>
</tt>8<tt>
</tt>9<tt>
</tt><strong>10</strong><tt>
</tt>11<tt>
</tt>12<tt>
</tt>13<tt>
</tt>14<tt>
</tt><strong>15</strong><tt>
</tt>16<tt>
</tt>17<tt>
</tt>18<tt>
</tt>19<tt>
</tt><strong>20</strong><tt>
</tt>21<tt>
</tt>22<tt>
</tt>23<tt>
</tt>24<tt>
</tt><strong>25</strong><tt>
</tt>26<tt>
</tt>


  xml.instruct! <span class="sy">:xml</span>, <span class="sy">:version</span>=><span class="s"><span class="dl">"</span><span class="k">1.0</span><span class="dl">"</span></span>, <span class="sy">:encoding</span>=><span class="s"><span class="dl">"</span><span class="k">UTF-8</span><span class="dl">"</span></span><tt>
</tt>  xml.chart <span class="r">do</span><tt>
</tt>    <span class="c"># xml.message "You can broadcast any message to chart from data XML file", :bg_color => "#FFFFFF", :text_color => "#000000"</span><tt>
</tt>    xml.series <span class="r">do</span>    <tt>
</tt>      <span class="iv">@cities</span>.each_with_index <span class="r">do</span> |city, index|<tt>
</tt>        xml.value city.name, <span class="sy">:xid</span> => index<tt>
</tt>      <span class="r">end</span><tt>
</tt>    <span class="r">end</span><tt>
</tt><tt>
</tt>    xml.graphs <span class="r">do</span><tt>
</tt>     <span class="c">#the gid is used in the settings file to set different settings just for this graph</span><tt>
</tt>      xml.graph <span class="sy">:gid</span> => <span class="s"><span class="dl">'</span><span class="k">population</span><span class="dl">'</span></span> <span class="r">do</span><tt>
</tt>        <span class="iv">@cities</span>.each_with_index <span class="r">do</span> |city, index|<tt>
</tt>          population = city.population<tt>
</tt>          <span class="r">case</span> population<tt>
</tt>            <span class="c"># When the population is > 1 million, show the bar in red/pink</span><tt>
</tt>            <span class="r">when</span> > <span class="i">100000</span><tt>
</tt>              xml.value value, <span class="sy">:xid</span> => index, <span class="sy">:color</span> => <span class="s"><span class="dl">"</span><span class="k">#ff43a8</span><span class="dl">"</span></span>, <span class="sy">:gradient_fill_colors</span> => <span class="s"><span class="dl">"</span><span class="k">#960040,#ff43a8</span><span class="dl">"</span></span>, <span class="sy">:description</span> => level<tt>
</tt>            <span class="r">else</span><tt>
</tt>              xml.value value, <span class="sy">:xid</span> => index, <span class="sy">:color</span> => <span class="s"><span class="dl">"</span><span class="k">#00C3C6</span><span class="dl">"</span></span>, <span class="sy">:gradient_fill_colors</span> => <span class="s"><span class="dl">"</span><span class="k">#009c9d,#00C3C6</span><span class="dl">"</span></span>, <span class="sy">:description</span> => level<tt>
</tt>            <span class="r">end</span><tt>
</tt>        <span class="r">end</span><tt>
</tt>      <span class="r">end</span><tt>
</tt>    <span class="r">end</span><tt>
</tt><tt>
</tt>  <span class="r">end</span>
Nothing fancy, we first created a series with all the city names:
1<tt>
</tt>2<tt>
</tt>3<tt>
</tt>4<tt>
</tt><strong>5</strong><tt>
</tt>


  xml.series <span class="r">do</span>    <tt>
</tt>    <span class="iv">@cities</span>.each_with_index <span class="r">do</span> |city, index|<tt>
</tt>      xml.value city.name, <span class="sy">:xid</span> => index<tt>
</tt>    <span class="r">end</span><tt>
</tt>  <span class="r">end</span>
Then we created another node with the values for each city. Since it would be cool to display some bars in a different color, we used a case-switch statement:
1<tt>
</tt>2<tt>
</tt>3<tt>
</tt>4<tt>
</tt><strong>5</strong><tt>
</tt>6<tt>
</tt>7<tt>
</tt>8<tt>
</tt>9<tt>
</tt><strong>10</strong><tt>
</tt>11<tt>
</tt>12<tt>
</tt>


    xml.graph <span class="sy">:gid</span> => <span class="s"><span class="dl">'</span><span class="k">population</span><span class="dl">'</span></span> <span class="r">do</span><tt>
</tt>      <span class="iv">@cities</span>.each_with_index <span class="r">do</span> |city, index|<tt>
</tt>        population = city.population<tt>
</tt>        <span class="r">case</span> population<tt>
</tt>          <span class="c"># When the population is > 1 million, show the bar in red/pink</span><tt>
</tt>          <span class="r">when</span> > <span class="i">100000</span><tt>
</tt>            xml.value value, <span class="sy">:xid</span> => index, <span class="sy">:color</span> => <span class="s"><span class="dl">"</span><span class="k">#ff43a8</span><span class="dl">"</span></span>, <span class="sy">:gradient_fill_colors</span> => <span class="s"><span class="dl">"</span><span class="k">#960040,#ff43a8</span><span class="dl">"</span></span>, <span class="sy">:description</span> => level<tt>
</tt>          <span class="r">else</span><tt>
</tt>            xml.value value, <span class="sy">:xid</span> => index, <span class="sy">:color</span> => <span class="s"><span class="dl">"</span><span class="k">#00C3C6</span><span class="dl">"</span></span>, <span class="sy">:gradient_fill_colors</span> => <span class="s"><span class="dl">"</span><span class="k">#009c9d,#00C3C6</span><span class="dl">"</span></span>, <span class="sy">:description</span> => level<tt>
</tt>          <span class="r">end</span><tt>
</tt>      <span class="r">end</span><tt>
</tt>    <span class="r">end</span>
Depending on what you want to display, you might need to have different colors or a different tooltip text, or load an animation or image… and as you can see, it’s REALLY easy.
Got to https://yoursite.com/reports/population to enjoy your new fancy graph.
That’s it, you are done!
Time to tweak your settings file to make your graph look awesome. Since you now have a lot of free time, you can start re-factoring your code and make sure you have a good test coverage.
Good luck!
