
Drawing Waveforms in Flutter
In the previous article, I explained what data we needed to generate waveforms and showed how to use a BBC Free Open Source Software to generate that data. In this article, I will show how to draw a waveform using Google’s Flutter UI toolkit for mobile, desktop and web. Here is the end result will are going for:
You can play with the web version of the UI here, thanks to Flutter web!
Why Flutter?
You might not be familiar with Flutter and might be surprised I’m using this technology to demonstrate how to draw waveforms. There are a few reasons behind my choice, first and foremost, drawing waveforms on the web is pretty well taken care of by a bunch of JS libraries. On the other hand, drawing waveforms in non-browser based environments isn’t as well documented. The second reason is that since Flutter now also targets the web (in beta), I can link to actual renderings from this blog. Finally, it’s a good excuse to write a fun Flutter tutorial :)
Setting up our project
I don’t expect that most of you to already know Flutter but the good news is that
ramping up is quite fast and I’ll walk you through the steps. Start by heading
to https://flutter.dev/ and
install Flutter. You can use Flutter on
Windows, Mac and Linux. If you want to target iOS, you need to have Xcode
installed. Install Android studio if you want to target Android. The instructions
are quite clear and the tooling is very helpful to make sure you have everything
setup correctly (thanks $ flutter doctor). Note that you don’t need a physical
device to test your code, you can run everything in the iOS simulator or the
Android emulator.
Start by creating an empty project:
$ flutter create waveform_demo
Flutter will let you know that everything went well and tell you how to
compile and run your project inside your connected device or simulator/emulator.
It will also indicate where our entry point is located (that’s the main.dart
file in the lib folder).
In order to run your application, type:

  $ cd waveform_demo
  $ flutter run

Your application code is in waveform_demo/lib/main.dart.
VSCode tips
I personally use VSCode as an editor and it has a great Flutter plugin with amazing tool integration from code completion to emulator launcher, debugger, profiler and refactoring tools. As a side note I also recommend Awesome Flutter Snippets and Bracket Pair Colorizer.
Tools you’d usually use
For this demo, we are going to keep our code simple so I won’t setup custom static analysis options, nor custom launcher icons and unfortunately, I won’t show how to write Flutter tests. Note that in a real life project, you’d want to set those things up (the good news is that you can find plenty of documentation on those topics).
Code organization
We are going to need two views, one that I will call painter_view and
another I’ll call clipper_view. We’ll set the app to render the clipper_view
view by default and add a bottom nav bar to go to the painter_view. In order
to save us time, I created a git
tag with the
code base.
To retrieve the code locally, clone the repo and switch to the tag:
git clone [email protected]:mattetti/waveform_demo.git
git checkout tags/v1-setup
I organized the files as shown below:
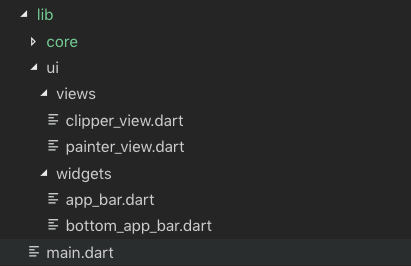
There aren’t hard conventions in the Flutter community on how to organize your files but that’s the pattern I personally use. I isolate UI concerns and model/logic.
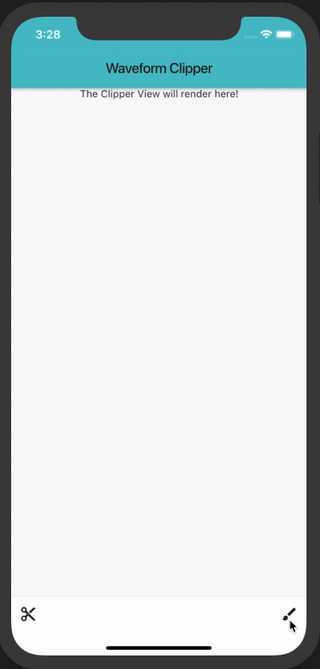
You can run the project (F5 in VSCode) to see our setup:
Loading the waveform data
We are almost to the drawing part of the article but we need to do one more thing, load the data. In a real life application we would probably make an HTTP call to load the json or binary file we generated server side but for this example, we will bundle our pre-generated file in the app and load it directly. For that we need to do 4 things:
- generate a json file (covered in the previous article)
- add it to the app
- create a model to load the file content
- create a loader function that we can use to load the content asynchronously.
To add json files to our app, we need to create an assets folder to move the files to and register the files in our pubspec.yaml manifest file.
I generated 2 json files called one-shot.json and loop.json and added them to assets/waveforms/.
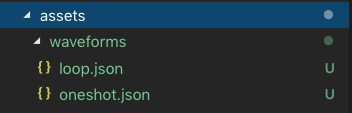
We then need to register them into our pubspec.yaml manifest:
  assets:
    - assets/waveforms/loop.json
    - assets/waveforms/oneshot.json
The files are now bundle with the app and we can load them programmatically.
Let’s add a loader service to do that. In lib/core/services let’s create a
waveform_data_loader.dart file. This file looks more like a helper than a
service but that’s fine for this demo. We want to setup an async function that
will return a future of the parsed json data. Returning a future is key here,
since we don’t know how long it takes to load and parse the json (especially if
it was to come from the network) and we can rely on Flutter’s excellent
FutureBuilder
widget. The
future builder builds itself once the data is available.
Here is what our code will look like:
Future<WaveformData> loadWaveformData(String filename) async {
  final data = await rootBundle.loadString("assets/waveforms/$filename");
  return WaveformData.fromJson(data);
}
While very straightforward, we need to first define our WaveformData class
that will parse the JSON file.
Let’s create a model file as lib/core/models/waveform_data_model.dart and have
that class represent the waveform data. I don’t usually write JSON
serializers/deserializers by hand since it’s quite cumbersome and can be
automated quickly and reliably. I like to use
https://app.quicktype.io/ and paste the JSON data I
want to parse and have it generate the dart code I can use in my app. The code
on its own isn’t very interesting, but here is a quick snapshot of the class
members:
class WaveformData {
  int version;
  // number of channels (only mono files are currently supported)
  int channels;
  // original sample rate
  int sampleRate;
  // indicates how many original samples have been analyzed per frame. 256 samples -> frame of min/max
  int sampleSize;
  // bit depth of the data
  int bits;
  // the number of frames contained in the data
  int length;
  // data is in frames with min and max values for each sampled data point.
  List<int> data;

  WaveformData({
    this.version,
    this.channels,
    this.sampleRate,
    this.sampleSize,
    this.bits,
    this.length,
    this.data,
  });

 // ...
}
And we are done with data loading. We now have a way to load the json files we bundled in the app load make their content available to our UI.
The code is available in this tag.
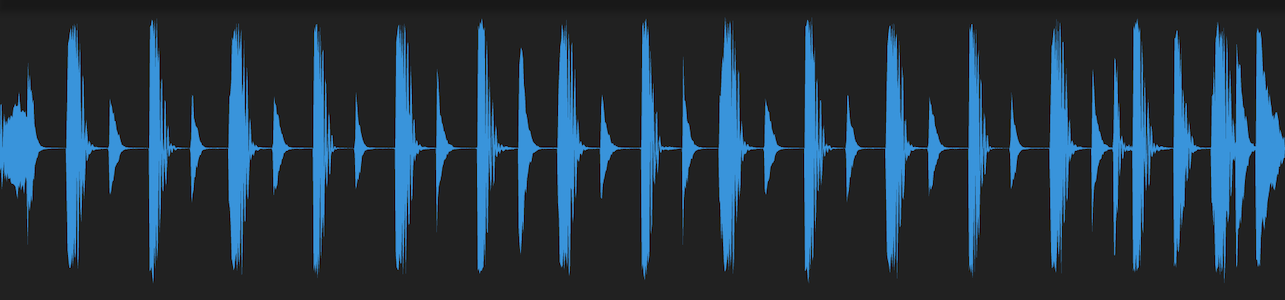
Drawing the actual waveform
We are finally getting to the core of this article.
What we want is to render a waveform like this but inside our app:
Painted view
This view is quite straightforward:
Center(
  child: FutureBuilder<WaveformData>(
    future: loadWaveformData("oneshot.json"),
    builder: (BuildContext context, AsyncSnapshot<WaveformData> snapshot) {
      if (snapshot.hasData) {
        return PaintedWaveform(sampleData: snapshot.data);
      } else if (snapshot.hasError) {
        return Text("Error ${snapshot.error}", style: TextStyle(color: Colors.red));
      }
      return CircularProgressIndicator();
    },
  ),
)
We are using a FutureBuilder widget, to render/build once the JSON data is
parsed. The builder function will receive a snapshot containing the waveform
data. Because the builder is called right away, we want to check the state of
the snapshot and render a progress indicator or an error if the parsing failed!
However if the snapshot has good data, we are going to render the waveform!
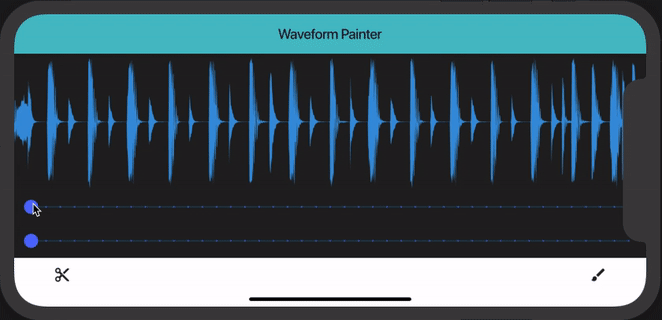
Note that the code above renders a widget called PaintedWaveform, this is a widget we need to create ourselves.
Let’s write it!
class PaintedWaveform extends StatefulWidget {
  PaintedWaveform({
    Key key,
    @required this.sampleData,
  }) : super(key: key);

  final WaveformData sampleData;

  @override
  _PaintedWaveformState createState() => _PaintedWaveformState();
}

class _PaintedWaveformState extends State<PaintedWaveform> {
  double startPosition = 1.0;
  double zoomLevel = 1.0;

  @override
  Widget build(context) {
    return Container(
      color: Colors.black87,
      child: Column(
        mainAxisAlignment: MainAxisAlignment.spaceBetween,
        children: <Widget>[
          Flexible(
            flex: 4,
            child: LayoutBuilder(
              builder: (context, BoxConstraints constraints) {
                // adjust the shape based on parent's orientation/shape
                // the waveform should always be wider than taller
                var height;
                if (constraints.maxWidth < constraints.maxHeight) {
                  height = constraints.maxWidth;
                } else {
                  height = constraints.maxHeight;
                }

                return Container(
                  child: Row(
                    children: <Widget>[
                      CustomPaint(
                        size: Size(
                          constraints.maxWidth,
                          height,
                        ),
                        foregroundPainter: WaveformPainter(
                          widget.sampleData,
                          zoomLevel: zoomLevel,
                          startingFrame: widget.sampleData.frameIdxFromPercent(startPosition),
                          color: Color(0xff3994DB),
                        ),
                      ),
                    ],
                  ),
                );

              },
            ),
          ),

          Flexible(
            child: Slider(
              activeColor: Colors.indigoAccent,
              min: 1.0,
              max: 95.0,
              divisions: 42,
              onChanged: (newzoomLevel) {
                setState(() => zoomLevel = newzoomLevel);
              },
              value: zoomLevel,
            ),
          ),

          Flexible(
            child: Slider(
              activeColor: Colors.indigoAccent,
              min: 1.0,
              max: 95.0,
              divisions: 42,
              onChanged: (newstartPosition) {
                setState(() => startPosition = newstartPosition);
              },
              value: startPosition,
            ),
          )

        ],
      ),
    );
  }
}
It might seem like there is a lot going on in there but it’s not that bad, let’s break it down.
The first thing you should notice is that instead of rendering our waveform
right away, we are using a LayoutBuilder widget so we can get the size of the
rendering area at runtime and adjust the dimensions accordingly.
The builder creates the layout which contains a CustomPaint widget. That’s the
key widget to render our waveform!
CustomPaint(
  size: Size(
    constraints.maxWidth,
    height,
  ),
  foregroundPainter: WaveformPainter(
    widget.sampleData,
    zoomLevel: zoomLevel,
    startingFrame: widget.sampleData.frameIdxFromPercent(startPosition),
    color: Color(0xff3994DB),
  ),
),
Here is a great quick video about CustomPaint:
As explained in the video, we need to implement a custom painter to tell the
widget what to draw. For that, we are going to code WaveformPainter:
class WaveformPainter extends CustomPainter {
  final WaveformData data;
  final int startingFrame;
  final double zoomLevel;
  Paint painter;
  final Color color;
  final double strokeWidth;

  WaveformPainter(this.data,
      {this.strokeWidth = 1.0, this.startingFrame = 0, this.zoomLevel = 1, this.color = Colors.blue}) {
    painter = Paint()
      ..style = PaintingStyle.fill
      ..color = color
      ..strokeWidth = this.strokeWidth
      ..isAntiAlias = true;
  }

  @override
  void paint(Canvas canvas, Size size) {
    if (data == null) {
      return;
    }

    final path = data.path(size, fromFrame: startingFrame, zoomLevel: zoomLevel);
    canvas.drawPath(path, painter);
  }

  @override
  bool shouldRepaint(WaveformPainter oldDelegate) {
    if (oldDelegate.data != data) {
      debugPrint("Redrawing");
      return true;
    }
    return false;
  }
}
You probably expected to see the path drawing code in this class, however the
paint method delegates most of the heavy lifting to the WaveformData class
as shown here:
void paint(Canvas canvas, Size size) {
  if (data == null) {
    return;
  }

  final path = data.path(size, fromFrame: startingFrame, zoomLevel: zoomLevel);
  canvas.drawPath(path, painter);
}
I ended up moving the path generation to the WaveformData class since we need
some logic to implement scrolling and zooming and we might want to use the path
to render within a widget that might not take a painter.
Let’s jump to WaveformData and see how I implemented the path drawing:
class WaveformData {
  // [...]
  List<int> data;
  List<double> _scaledData;
  // [...]

  List<double> scaledData() {
    if (!_isDataScaled()) {
      _scaleData();
    }
    return _scaledData;
  }

  Path path(Size size, {zoomLevel = 1.0, int fromFrame = 0}) {
    if (!_isDataScaled()) {
      _scaleData();
    }

    if (zoomLevel == null || zoomLevel < 1.0) {
      zoomLevel = 1.0;
    } else if (zoomLevel > 100.0) {
      zoomLevel = 100.0;
    }

    if (zoomLevel == 1.0 && fromFrame == 0) {
      return _path(_scaledData, size);
    }

    // buffer so we can't start too far in the waveform, 90% max
    if (fromFrame * 2 > (data.length * 0.98).floor()) {
      debugPrint("from frame is too far at $fromFrame");
      fromFrame = ((data.length / 2) * 0.98).floor();
    }

    int endFrame = (fromFrame * 2 + ((_scaledData.length - fromFrame * 2) * (1.0 - (zoomLevel / 100)))).floor();
    return _path(_scaledData.sublist(fromFrame * 2, endFrame), size);
  }

  Path _path(List<double> samples, Size size) {
    final middle = size.height / 2;
    var i = 0;

    List<Offset> minPoints = [];
    List<Offset> maxPoints = [];

    final t = size.width / samples.length;
    for (var _i = 0, _len = samples.length; _i < _len; _i++) {
      var d = samples[_i];

      if (_i % 2 != 0) {
        minPoints.add(Offset(t * i, middle - middle * d));
      } else {
        maxPoints.add(Offset(t * i, middle - middle * d));
      }

      i++;
    }

    final path = Path();
    path.moveTo(0, middle);
    maxPoints.forEach((o) => path.lineTo(o.dx, o.dy));
    // back to zero
    path.lineTo(size.width, middle);
    // draw the minimums backwards so we can fill the shape when done.
    minPoints.reversed.forEach((o) => path.lineTo(o.dx, middle - (middle - o.dy)));

    path.close();
    return path;
  }

  // get the frame position at a specific percent of the waveform. Can use a 0-1 or 0-100 range.
  int frameIdxFromPercent(double percent) {
    if (percent == null) {
      return 0;
    }

    // if the scale is 0-1.0
    if (percent < 0.0) {
      percent = 0.0;
    } else if (percent > 100.0) {
      percent = 100.0;
    }

    if (percent > 0.0 && percent < 1.0) {
      return ((data.length.toDouble() / 2) * percent).floor();
    }

    int idx = ((data.length.toDouble() / 2) * (percent / 100)).floor();
    final maxIdx = (data.length.toDouble() / 2 * 0.98).floor();
    if (idx > maxIdx) {
      idx = maxIdx;
    }
    return idx;
  }

  bool _isDataScaled() {
    return _scaledData != null && _scaledData.length == data.length;
  }

  // scale the data from int values to float
  // TODO: consider adding a normalization option
  _scaleData() {
    final max = pow(2, bits - 1).toDouble();

    final dataSize = data.length;
    _scaledData = List<double>(dataSize);
    for (var i = 0; i < dataSize; i++) {
      _scaledData[i] = data[i].toDouble() / max;
      if (_scaledData[i] > 1.0) {
        _scaledData[i] = 1.0;
      }
      if (_scaledData[i] < -1.0) {
        _scaledData[i] = -1.0;
      }
    }
  }

}
So there is a lot going on in here, let’s unpack it and take a look at how we
scale the samples. The BBC tool we use stores the peaks and valleys as integer
values with a specific bit depth (8 or 16bit). We want to scale this data to a
-1,+1 range and that’s what _scaleData() does if we haven’t yet scaled the
samples. To access our scaled data, we can simply call scaledData() which will
check if scaling is needed and return a scaled version of our samples.
Now that the data scaling is out of the way, let’s jump to our entry point:
Path path(Size size, {zoomLevel = 1.0, int fromFrame = 0}) {
  //...
}
This is the function that returns the waveform path based on a provided size and some optional zooming and scrolling arguments. I’ll skip the zooming and scrolling explanations in this post to focus on the drawing itself. That takes us to this line:
return _path(_scaledData.sublist(fromFrame * 2, endFrame), size);
We are delegating to a private method passing a potential subset of our samples and our size. This is where the path drawing is actually happening.
Path _path(List<double> samples, Size size) {
  final middle = size.height / 2;
  var i = 0;

  List<Offset> minPoints = [];
  List<Offset> maxPoints = [];

  final t = size.width / samples.length;
  for (var _i = 0, _len = samples.length; _i < _len; _i++) {
    var d = samples[_i];

    if (_i % 2 != 0) {
      minPoints.add(Offset(t * i, middle - middle * d));
    } else {
      maxPoints.add(Offset(t * i, middle - middle * d));
    }

    i++;
  }

  final path = Path();
  path.moveTo(0, middle);
  maxPoints.forEach((o) => path.lineTo(o.dx, o.dy));
  // back to zero
  path.lineTo(size.width, middle);
  // draw the minimums backwards so we can fill the shape when done.
  minPoints.reversed.forEach((o) => path.lineTo(o.dx, middle - (middle - o.dy)));

  path.close();
  return path;
}
The path drawing methods are close to the methods you’d find on the HTML canvas or other path drawing solutions, we want to draw a path showing the outline of the waveform and close it at the end.
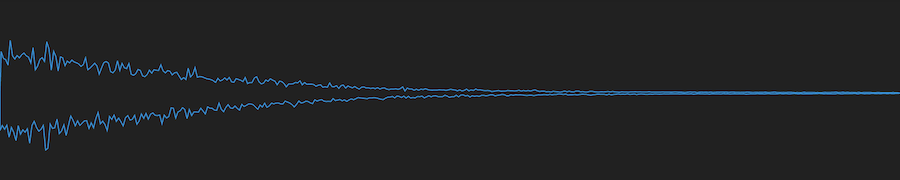
Waveforms can be drawn as a stereo rendering where the top part is a channel and the bottom part is the other channel. But most of the time, the signal is converted into one channel (mono). There are 2 common approaches to drawing mono waveforms. The first one is to take the amplitude average of a time window and draw each window. Then we can mirror the graph to create the expected waveform shape.
This seems to be the approach SoundCloud went for:
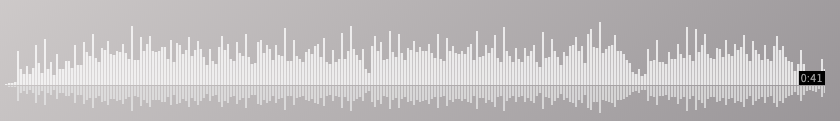
Which seems to be confirmed by looking at the JSON data they use to draw the waveforms:
{
  "width":1800,
  "height":140,
  "samples":[4,9,9,9,9,9,9,9,9,9,9,9,10,9,9,8,9,9,9,10,9,22,101,100,100,94,91,85,75,69,60,53,46,45,42,42,39,34,34,35,34,32,26,27,57,55,55,53,52,48,42,35,33,57,61,57,58,5, ...]
}
This is an absolutely valid approach but it provides less details than the BBC/Audacity approach which might be used by audio editors or musicians.
This second approach has 2 amplitude ranges, the max values and the min values. The top part of the waveform shows the peak value for each sampled time windows, the bottom part shows the minimum value for the same time windows. This approach is nice if you want to highlight the dynamic range of an audio signal. Knowing that, we can can draw our two waveform shapes.
The drawing algorithm is quite simple, we convert each sample value into a coordinate knowing that the lowest value is at the middle of the display area and the max value is all the way to the top for max values, and all the way to the bottom for the min values.
Another way to say the same thing is that we need to calculate the x and y values for each sample where:
x = (display size / number of samples) * index of specific sampley = half the display height - (half the display height * sample value)
In code where i is the index of the sample we want to convert to coordinates:
middle = size.height / 2;
t = size.width / samples.length;
Offset(
  dx: t * i,
  dy: middle - middle * samples[i]
);
Once we have our 2 vectors of points, we can draw our max line:
final path = Path();
path.moveTo(0, middle);
// draw a line going through each max value coordinate
maxPoints.forEach((o) => path.lineTo(o.dx, o.dy));

// back to zero
path.lineTo(size.width, middle);
This will draw a line going from middle left all the way to the right, going back to the zero value. To draw our minimum value contour, we want to continue the line we started. Reading our coordinates in the reverse order going from the last sample back to the first one would allow us to draw the line continuously. We also need to draw our line mirrored meaning that our max value should be at the bottom of the display/drawing area. This is something we can so on the fly by altering the y coordinate value.
// draw the minimums backwards so we can fill the shape when done.
minPoints.reversed.forEach((o) => path.lineTo(o.dx, middle - (middle - o.dy)));

path.close();
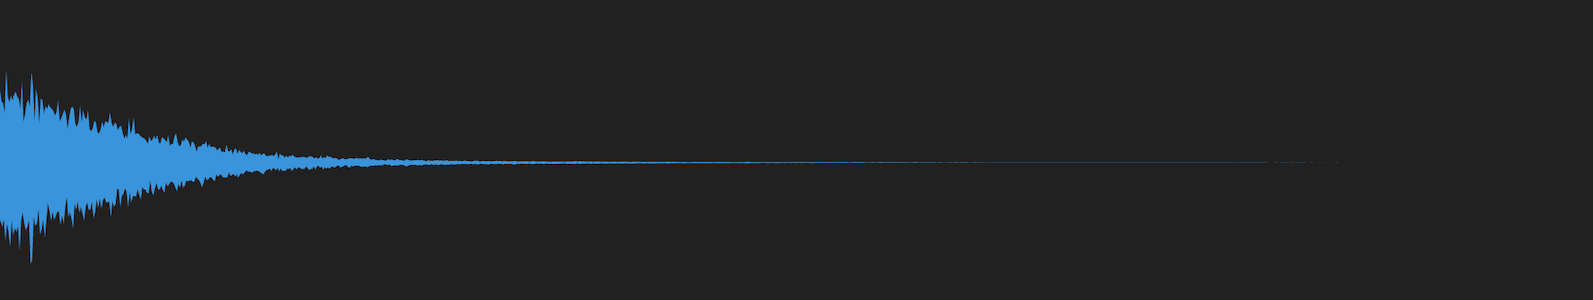
Here is how the path looks like if we don’t fill it:
If you wanted to customize the rendering style, you would do that in the WaveformPainter class.
Alternative renderings
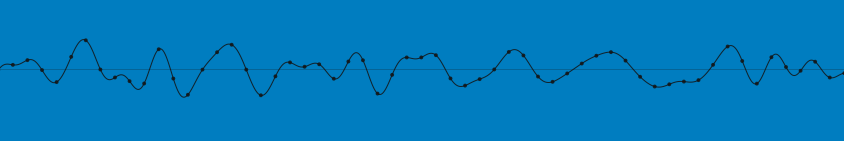
I opted to draw a line going straight through each coordinate, note that if you wanted the SoundCloud style, you’d instead draw rectangles for each sample. There are a lot of options to make the rendering more interesting, for instance you could draw rectangles when zoomed out, draw lines when getting closer and draw curved lines and sample dots when zoomed-in really closely as shown here in Ableton Live:
Clipper view
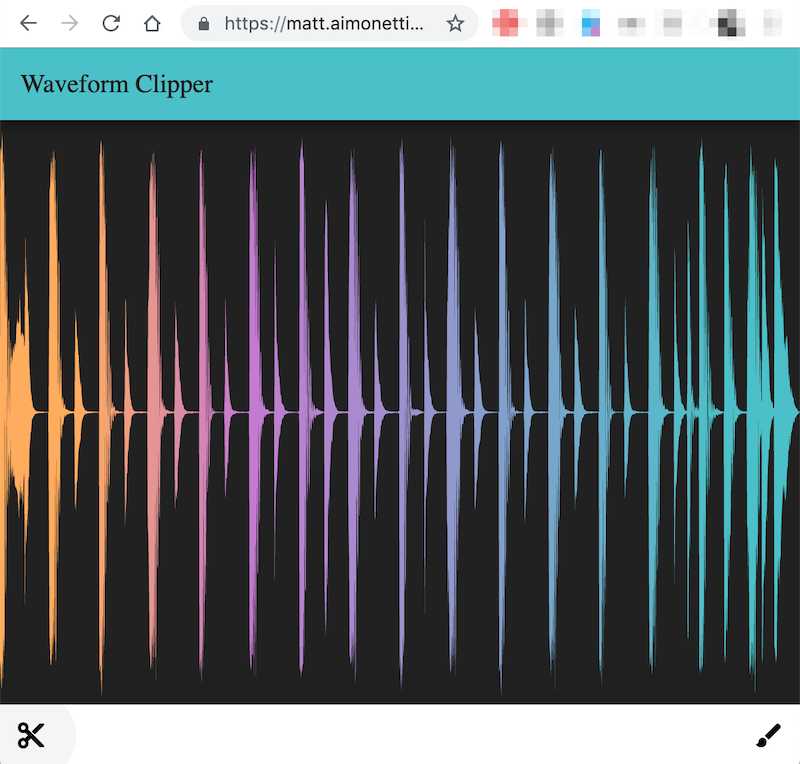
Finally, I want to show another cool way to use our waveform path by creating a clipper view allowing us to use our waveform path as a mask for another image (a gradient in this case, but you could use an image or anything really). A concrete product example would be if you analyzed the spectrum of your signal and wanted to show the main frequency range of each window by assigning different colors. This feature is commonly seen in DJ software.
To do that, we are going to use the ClipPath widget which will render our waveform through a gradient container (also provided by built-in widgets).
return ClipPath(
  clipper: WaveformClipper(snapshot.data),
  child: Container(
    height: height,
    decoration: BoxDecoration(
      gradient: LinearGradient(
        begin: Alignment.centerLeft,
        end: Alignment.centerRight,
        stops: [0.1, 0.3, 0.9],
        colors: [
          Color(0xffFEAC5E),
          Color(0xffC779D0),
          Color(0xff4BC0C8),
        ],
      ),
    ),
  ),
);
We need to implement our CustomClipper which is super straightforward since we already extracted the path drawing logic into our WaveformData class. This refactoring results in allowing us get a clipper in just a few lines of code:
class WaveformClipper extends CustomClipper<Path> {
  WaveformClipper(this.data);

  final WaveformData data;

  @override
  Path getClip(Size size) {
    return data.path(size);
  }

  @override
  bool shouldReclip(WaveformClipper oldClipper) {
    if (data != oldClipper.data) {
      return true;
    }
    return false;
  }
}
Conclusion
Drawing waveforms isn’t that complicated but you need to assemble a lot of parts together to get there. First we need data processing to extract a reduced version of the information we need to draw an amplitude map. Then we need a way to load and parse this data. We need to have a way to position our rendered waveform in our layout in a dynamic way (based on screen size, device orientation etc..). And finally we need to draw the waveform.
Once we have everything setup, we have a flexible and performant solution to explore more creative ways to render our waveform such as using a clipper, animations or maybe going for a totally different style like circular waveforms.